

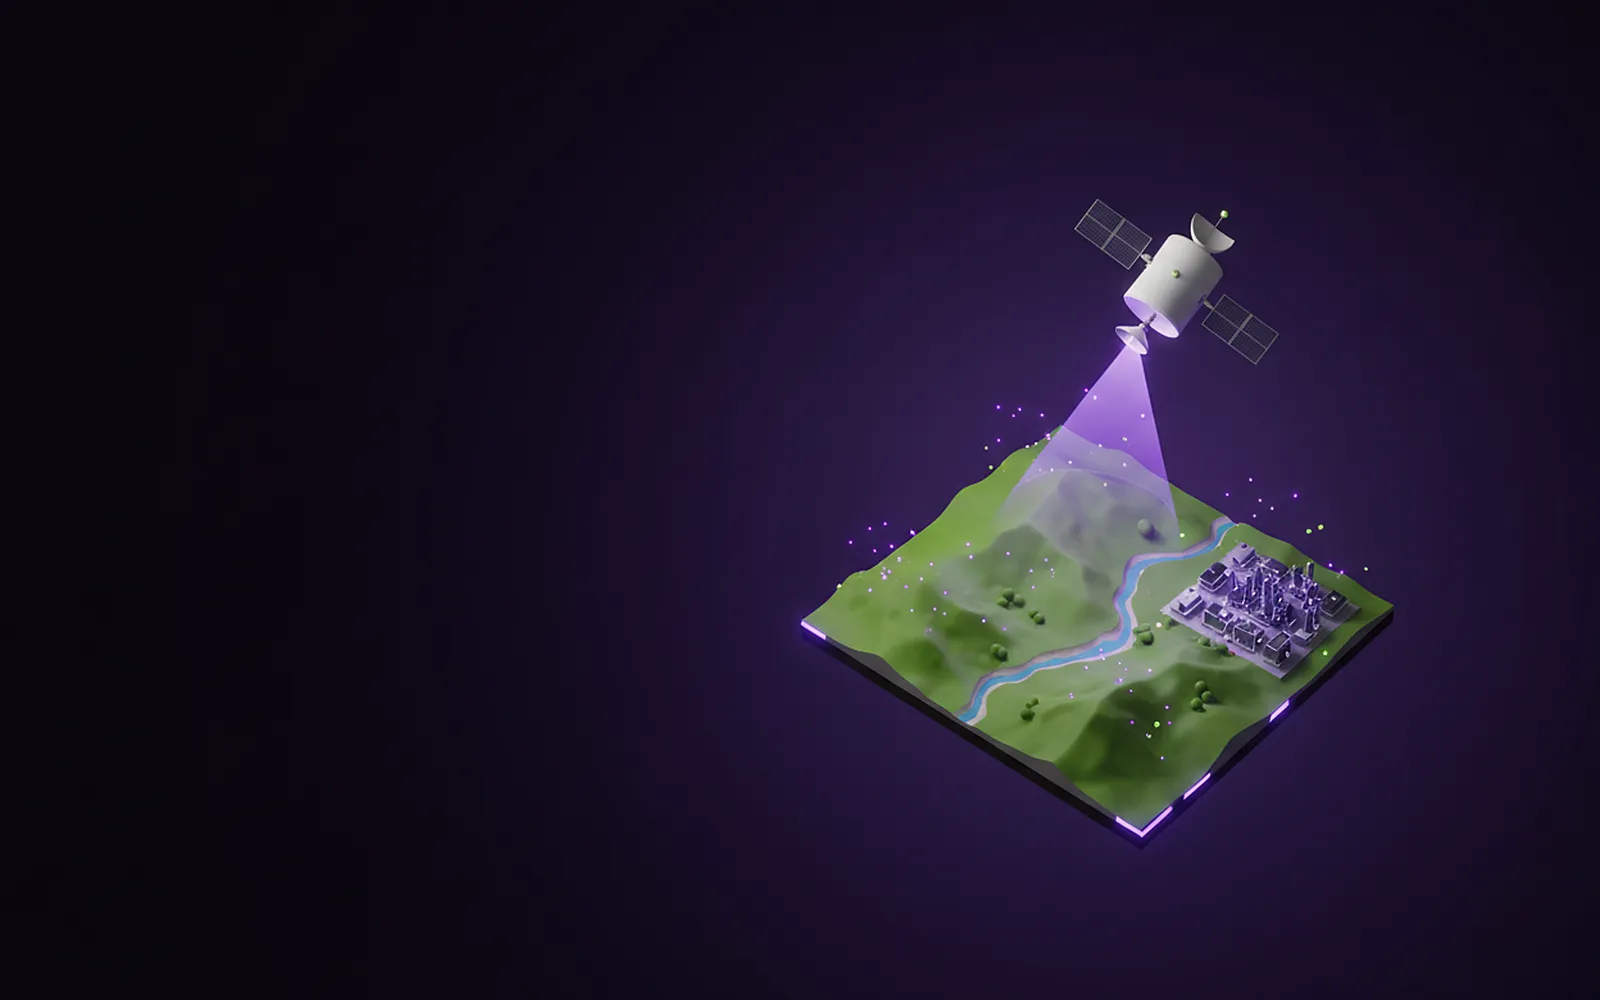
The territory changes every week. From low Earth orbit, it can now be measured
Artificial intelligence turns satellite imagery into alerts that a mayor, an environmental authority or an operations manager can use.
The problem
Land-use change, deforestation, floods and illegal mining advance without continuous monitoring. Without predictive tools, governments and companies react late.
Our approach
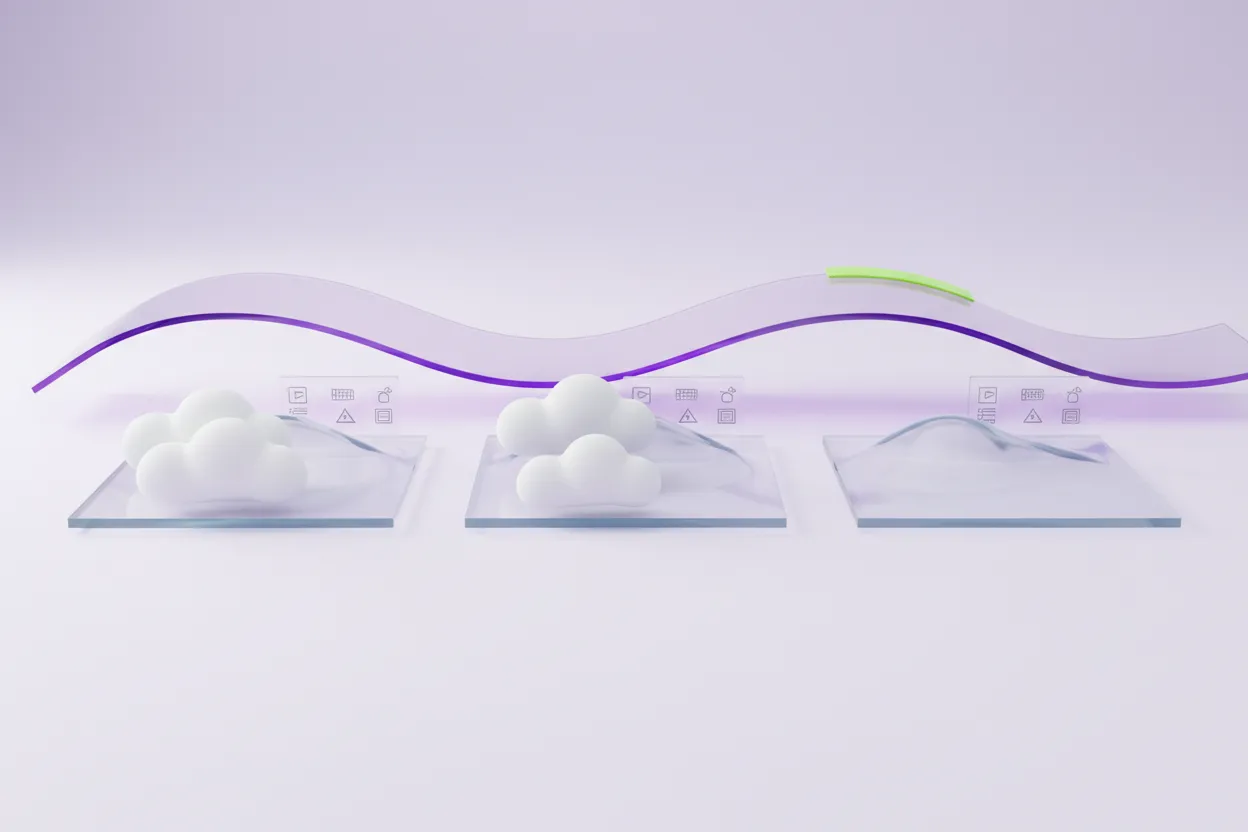
We analyze Sentinel-2 image series and NASA POWER climate series, detect changes in the territory and build analytics and foresight models for cities and territories with CUANTICO Earth AI.
What is Earth observation?
It is the systematic capture of information about the Earth’s surface, water and atmosphere from remote sensors, mainly satellites. It is no longer a resource reserved for space agencies: public programs such as the European Union’s Copernicus and NASA’s programs publish their data openly. Any territory, however small its budget, can have space-grade information.
Low Earth orbit (LEO) satellites orbit between roughly 160 and 2,000 km high, much closer than geostationary satellites at about 36,000 km. That is why they capture more detail and, working as a constellation, revisit the same spot every few days.
The two sources CUANTICO works with
They complement each other: Sentinel-2 shows the state of the territory and NASA POWER explains the conditions that drive it. Together they build time series, and the models come from those time series.
| Source | What it provides | Characteristics |
|---|---|---|
| Sentinel-2 (Copernicus program, European Space Agency) | Multispectral imagery of the territory: vegetation, soil, water and built-up areas. | Low Earth orbit constellation with 13 spectral bands at 10, 20 and 60 m resolution. Revisits the same spot every 5 days at the equator. Open data. |
| NASA POWER (Prediction Of Worldwide Energy Resources) | Climate and energy series: temperature, precipitation, humidity, wind and solar radiation. | Global daily data since 1981, derived from NASA satellite observations and models. Open access through an API. |
Specifications checked on September 24, 2026 against the official Copernicus documentation (SentiWiki) and the NASA POWER methodology.
What does AI do with that imagery?
A single satellite scene weighs hundreds of megabytes, and a territory produces thousands a year. No human team can review them all; AI models can.
The models can:
- Detect changes between two dates: forest that disappears or disturbed soil.
- Classify land cover: forest, crops, water, bare soil or urban area.
- Measure indices such as the vegetation index (NDVI) and track their trend over time.
- Build cloud-free composites by combining several dates, key in tropical regions with persistent cloud cover.
- Fuse sources: imagery is combined with climate, cadastre, health, mobility and social data.
What can be monitored?
With imagery and climate series you can follow, week by week, what changes in a territory and anticipate what may come.
For example:
- Deforestation and land-use change.
- Mining fronts that appear outside titled areas.
- Crop health and agricultural productivity.
- Water sources, flood zones and drainage problems.
- Climate variables that anticipate risks to health or infrastructure.
Modules for cities and territories
Earth observation models feed CUANTICO Earth AI, CUANTICO’s product of AI models for cities and territories, where they are combined with health, mobility and safety data.
3D geoportals
The territory in 3D in the browser: a digital twin with high-precision maps and predictive models, compatible with digital cadastre and satellite data. It supports land-use planning, emergency and risk management, urban operations and citizen participation.
Climate change and biodiversity
Climate risk and environmental vulnerability maps, an ecosystem monitoring dashboard and reports with adaptation guidelines: early warning of floods and landslides, deforestation hotspots and water security.
Mobility
Traffic data from Waze for Cities, with the events users report (congestion, accidents, hazards and road closures, with date, time and location), on dashboards to anticipate congestion, simulate the effect of roadworks, events and closures, and prioritize road interventions where accidents concentrate.
Municipalities
An online portal per municipality with its map, traffic, public procurement, safety, agriculture and mobility, and a demographic profile based on DANE population projections and the 2018 census.
How do we apply it?
Analytics: what is happening today. Changes in vegetation cover, urban sprawl, crop water stress or areas exposed to flooding.
Foresight: what may happen tomorrow. Scenarios that combine the trend observed from space with climate series, to anticipate risks and prioritize investment.
An example: combining dengue cases by area with NASA POWER rainfall and temperature, and with areas of standing water or poor drainage seen in Sentinel-2, helps focus field teams where they have the most impact.
Mining and traceability: a natural connection
MinTrace records where each mineral is declared to come from. Earth observation can show whether there is extractive activity on that title. Together, documentary traceability and satellite evidence would strengthen due diligence across the chain. Today this is a research line of the CuantaIA group, not a MinTrace feature.
Who is it for?
For those who need to watch the territory continuously and decide with evidence.
We work with:
- Municipalities, regional governments and environmental authorities.
- Risk managers.
- Mining companies, agribusiness and infrastructure operators that need continuous monitoring.
- Buyers who must show that their supply chain is not linked to deforestation.
Frequently asked questions
Which satellite sources does CUANTICO use?
Sentinel-2, from the European Space Agency’s Copernicus program, for multispectral imagery, and NASA POWER for climate and energy series. Both are open access.
What resolution does the imagery have?
Sentinel-2 has 13 spectral bands at 10, 20 and 60 meter resolution and revisits the same spot every 5 days at the equator.
What about clouds?
Because Sentinel-2 passes frequently, several dates are combined to obtain a clear view of the territory.
Does it work for mineral traceability?
It is a research line: satellite evidence can complement MinTrace’s documentary traceability, but today it is not a product feature.
A case
 ICT Ministry · Universidad Distrital
Territorios IA
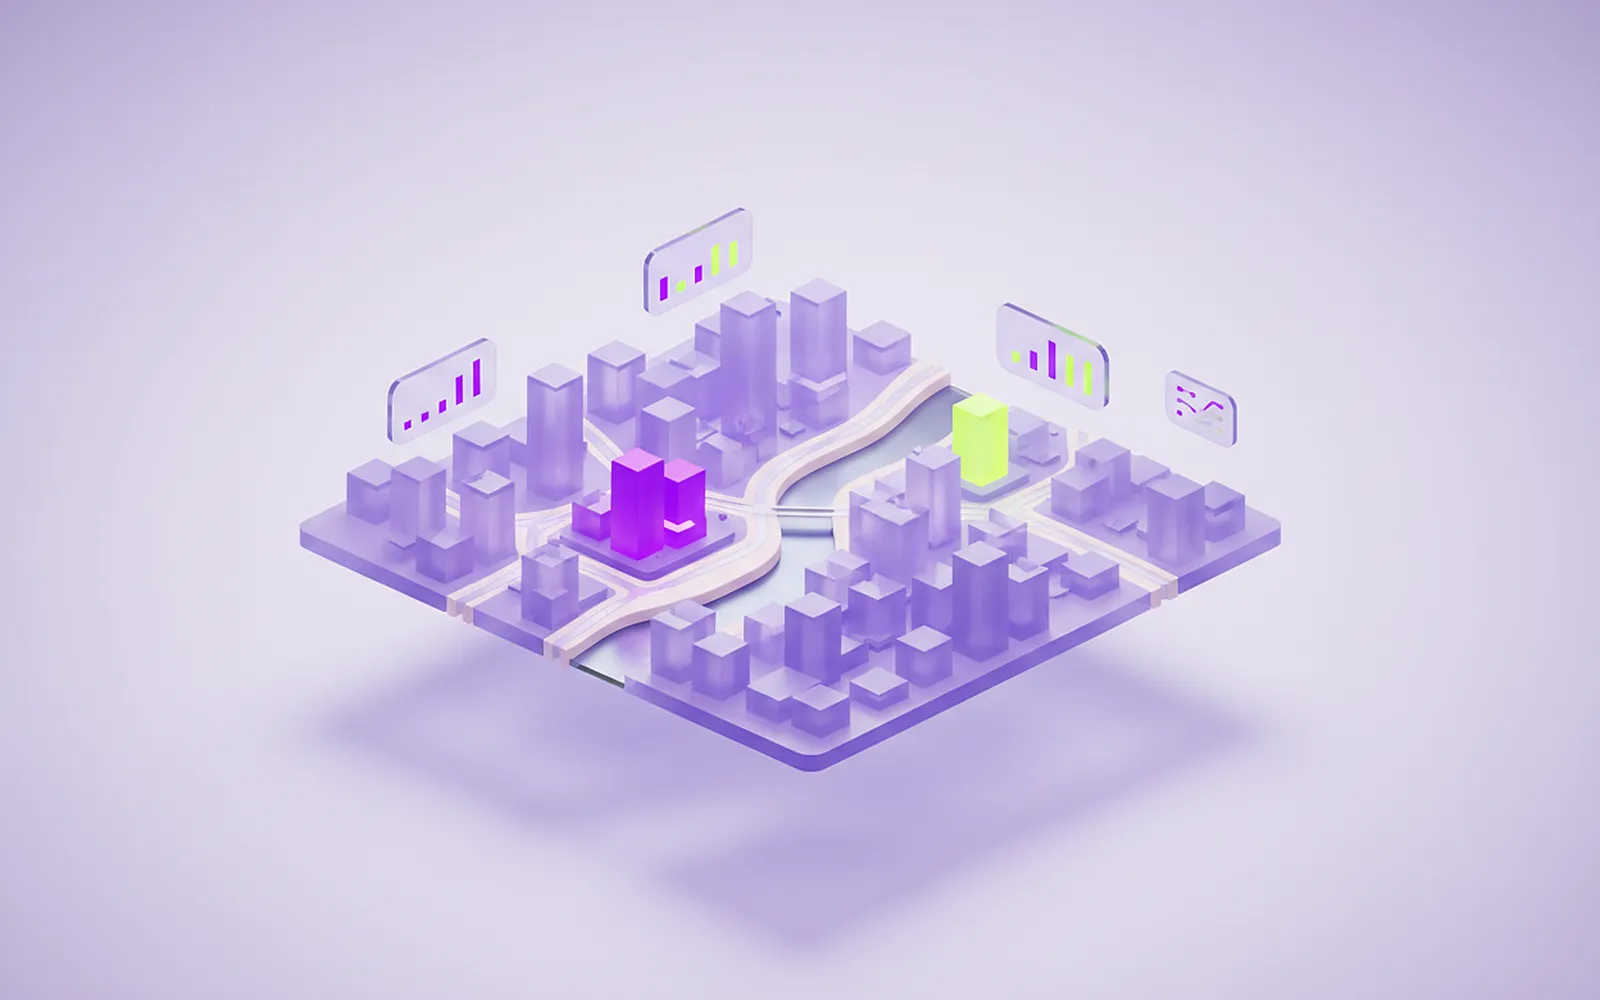
Territorios IA is a project of Colombia's ICT Ministry (MinTIC) developed by Universidad Distrital and CUANTICO with CUANTICO technology. Its goal is to equip 54 municipalities with data analytics and artificial intelligence platforms to support decisions on security, mobility, public procurement and climate change adaptation. Today it is operated by another provider on CUANTICO's base technology. That project's artificial intelligence models for territories are today the basis of CUANTICO Earth AI.
Read the project story
You may also be interested in
- GovTech
Public sector
We help public entities decide, specify and audit their technology: citizen services, records management and data.
Learn more - MinTrace
Mineral traceability
Every mineral should tell its story. MinTrace records it, from the mine to export.
Learn more CuantaIA group
CUANTICO’s applied research group: public health, public safety and Earth observation.
Learn more