


Risk models to allocate public safety resources better
Risk maps, alerts and operational dashboards to steer patrols and prevention with data.
The problem
Violence, emergencies and urban crime are growing, resources are limited and information is spread across sources that do not talk to each other. Police resources are allocated without risk prediction and the response comes late.
Our approach

We build risk and incident models by area and time of day, and bring them to dashboards that prioritize where and when to act.
What does AI do for public safety in your city?
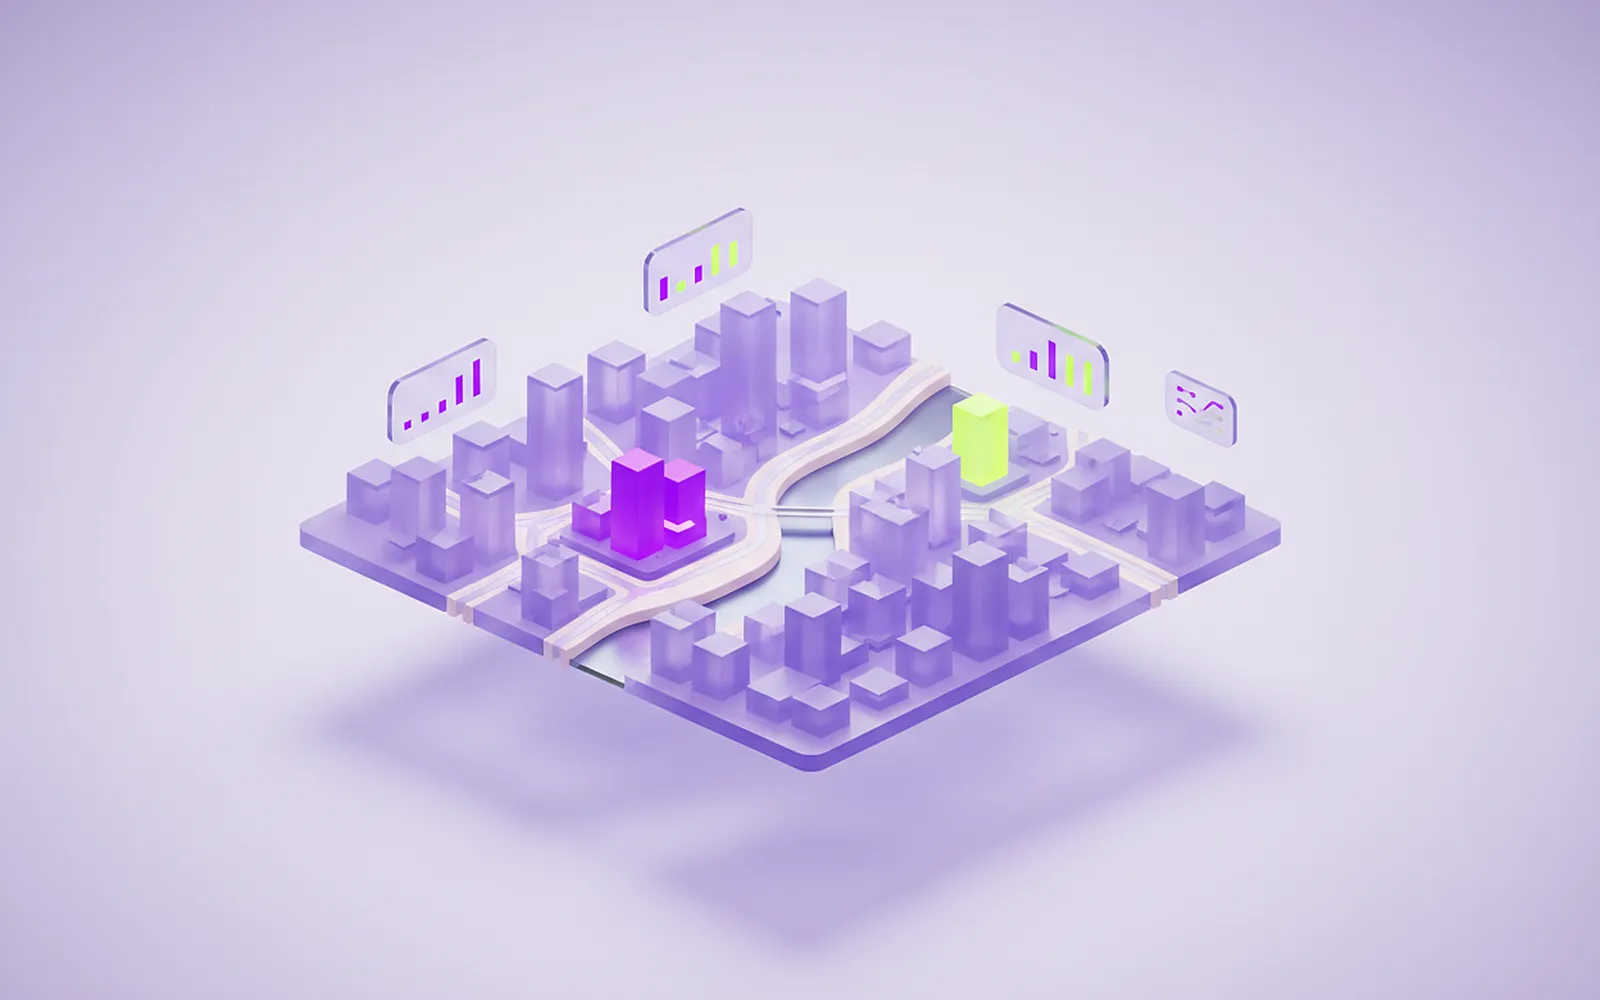
It brings together incident reports that are scattered today, detects risk patterns with predictive models, prioritizes critical areas and shows them on action dashboards. That lets you steer patrols and prevention with risk maps and alerts instead of reacting after the fact.
What it delivers:
- Risk maps by area and time of day.
- Alerts on the areas the model prioritizes.
- Real-time operational monitoring dashboards.
- Intervention reports with recommended actions.
- Incident and risk-layer APIs to connect with your systems.
A crime dashboard for each territory
The territorial dashboard brings safety indicators together in one view: crimes by category, gender-based crimes, thefts, accidents with victims, crimes this year compared with the previous period, and thefts in recent months by type.
It has separate views for crimes, homicides, thefts and injuries, so each team quickly finds what it needs to review.
What data does it use and how does the model work?
The model works with reported crime cases by territory and year. Each department is identified by its DANE code (Colombia's official statistics code), so the data can be matched unambiguously with other official sources. We follow the CRISP-DM methodology in six phases, from understanding the need to deployment.
How it is built:
- It groups territories by their crime pattern with K-Means and validates the groups with hierarchical clustering (Ward’s method).
- It projects the monthly case series with a SARIMA model to anticipate the following year.
- With those groups, each territory gets its own policies, and staff and equipment are allocated accordingly.
Who is it for?
For the agencies that decide where and when to prevent. It adapts to cities of any size and uses data that can be shown, which helps build public trust.
We work with:
- City and regional governments.
- Police.
- Emergency response agencies.
Frequently asked questions
Does the model point to individuals?
No. It works with cases aggregated by territory and period to prioritize areas and times of day.
What data does it need to start?
Reported crime cases by territory and period, identified by their official code. On that basis, territories are grouped and the case series is projected.
How does it connect with my agency’s systems?
Through incident and risk-layer APIs. It also delivers operational dashboards and intervention reports for teams that do not use those APIs.
A case
 ICT Ministry · Universidad Distrital
Territorios IA
Territorios IA is a project of Colombia's ICT Ministry (MinTIC) developed by Universidad Distrital and CUANTICO with CUANTICO technology. Its goal is to equip 54 municipalities with data analytics and artificial intelligence platforms to support decisions on security, mobility, public procurement and climate change adaptation. Today it is operated by another provider on CUANTICO's base technology. One of its verticals is public safety: a dashboard with the crime indicators of each territory.
Read the project story
You may also be interested in
- GovTech
Public sector
We help public entities decide, specify and audit their technology: citizen services, records management and data.
Learn more Earth observation
Sentinel-2 imagery and NASA POWER climate series for the analytics and foresight of cities and territories.
Learn moreFree Applied Machine Learning course
From data to models that work in production: 11 sections and 63 lessons, free and taught in Spanish.
Learn more